Part 1: Our role and outcomes
Everything we do is about improving the performance of, and the public's trust in, the public sector.
Our role
The Auditor-General is an Officer of Parliament who carries out her role independently from executive government and Parliament. She is accountable to Parliament for the public resources she uses to do her job. By law, the Auditor-General audits all public entities in New Zealand – a total of almost 4000 public entities, such as government departments, central agencies, Crown entities, schools, and State-owned enterprises. The role includes auditing local authorities, which are accountable to the public for the activities that they fund with revenue that they raise locally.
All public entities are accountable for how they use public resources and powers. It is the Auditor-General's job to give independent assurance to Parliament and the public about how public entities operate and account for how they perform.
Our organisation
Our work is carried out by about 370 staff in two business units – the Office of the Auditor-General (OAG) and Audit New Zealand, supported by a shared team of corporate services staff – and by auditors contracted from about 50 private sector accounting firms.
The OAG establishes strategy, sets policy and standards, appoints auditors and oversees how they perform, carries out performance audits, provides reports and advice to Parliament, and carries out inquiries and other special studies.
Audit New Zealand, the larger of the two business units, has offices in seven cities and carries out annual audits that the Auditor-General allocates to it. It provides other assurance services to public entities within the Auditor-General's mandate and in keeping with the Auditor-General's auditing standard on the independence of auditors.
How we make a difference
In carrying out our statutory objectives, we play an important role in influencing and promoting improvements in the public sector's performance and in building trust in the public sector.
We provide assurance and advice through services under three output classes – audit and assurance services, supporting accountability to Parliament, and performance audits and inquiries. The main impacts we aim to have are that our recommendations for improvement are responded to and acted on, and that our stakeholders are supported by, and get value from, our advice.
Our outcomes
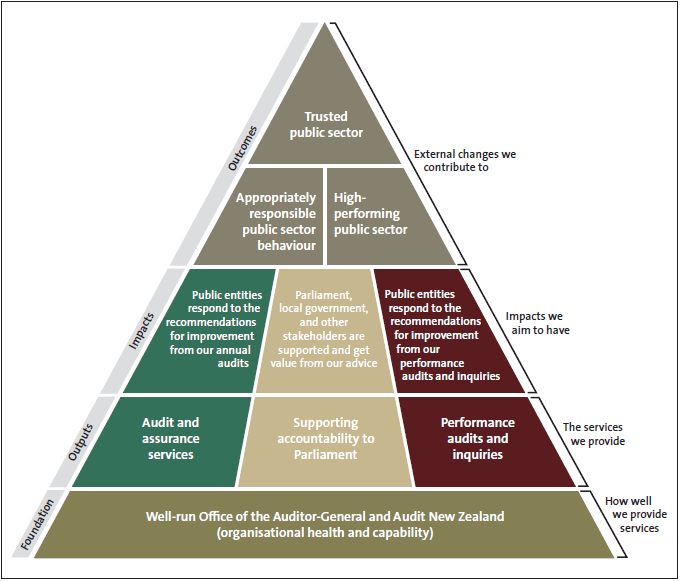
Figure 1 summarises our outcomes, the impacts we aim to have, and the services that we provide.
Figure 1
Outcomes framework


Achieving our outcomes
We assess that, in 2012/13, we maintained or improved our outcomes, with results as outlined below.
Outcome 1: Trusted public sector
| MEASURE | RESULT | COMMENT |
|---|---|---|
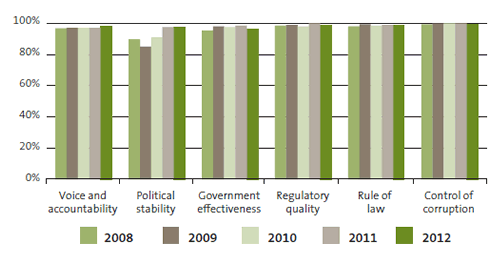
| New Zealand is ranked in or above the 90th percentile of the Worldwide Governance Indicators.1 | Achieved | New Zealand maintained its ranking in 2012, with all Worldwide Governance Indicators above the 96th percentile. Results for the Worldwide Governance Indicators are published in September each year for the previous calendar year. |
| Figure 2 New Zealand's ranking in the Worldwide Governance Indicators, 2008 to 2012  |
||
The State Services Commission's Kiwis Count Survey2 shows improved (or at least maintained) rates of public trust with:
|
Partly Achieved | This is a revised measure because the Kiwis Count Survey methodology has been redesigned. Data collection has been reported quarterly since June 2012. Respondents rate their perceptions of trust in the public service, and their perceptions of trust based on their most recent public service experience. From June 2012 to March 2013, perceptions of trust in the public service went down slightly (by one percentage point), while perceptions of trust based on most recent experience with public services went up by a similar amount. |
| New Zealand's score on the Transparency International Corruption Perceptions Index3 is improved (or at least maintained). | Achieved | New Zealand's 2012 score of 9.0 was lower than for the previous four years, but ranked it first in the world with Denmark and Finland. From 2008 to 2012, New Zealand's score has consistently been within the range of 9.0-9.5. |
Outcome 2: Appropriately responsible public sector behaviour
| MEASURE | RESULT | COMMENT |
|---|---|---|
Public entities' financial reports:
|
Almost achieved for audit opinions Not achieved for audit timeliness |
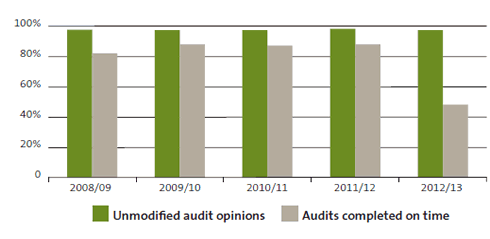
An unmodified audit opinion is an indicator that public entities are reporting appropriately and that their financial reports fairly reflect their actual performance. In 2012/13, 97% of audit opinions were unmodified, just short of our 98% target. Problems with Novopay4 (a new payroll system for schools) significantly affected the timeliness of audits completed in 2012/13. Only 48% of audits were completed on time, well below last year's 88%. |
| Figure 3 Percentage of unmodified audit opinions and audits completed on time, 2008/09 to 2012/13  |
||
Outcome 3: High-performing public sector
| MEASURE | RESULT | COMMENT | |
|---|---|---|---|
| The State Services Commission's Integrity and Conduct survey shows improved (or at least maintained) rates of State servants who report that State service agencies promote their standards of integrity and conduct. | Achieved when last surveyed | This survey is held every three years. The 2013 results are not yet available. Results from 2007 and 2010 show improved rates of State servants who think that their public entities promote their standards of integrity and conduct. | |
| The State Services Commission's Integrity and Conduct survey shows improved (or at least maintained) rates of State servants who reported that, where they observed misconduct breaches in the past year, they reported it. | Achieved when last surveyed | This survey is held every three years. The 2013 results are not yet available. Results from 2007 and 2010 show a declining rate of State servants who observed misconduct and an increasing number of State servants who, where they observed misconduct, reported it. | |
| The State Services Commission's Kiwis Count Survey shows improved (or at least maintained) rates of public service quality for all public services. | Achieved | This revised measure results from a redesign of the Kiwis Count Survey. Results collected every quarter show that, over the June 2012 to March 2013 period, respondents rated the quality of public services at a consistently high level of at least 72%. |
|
Strategic risks and risk management
The Auditor-General faces four ongoing strategic risks:
- loss of independence;
- audit failure;
- loss of capability; and
- loss of reputation.
We manage these risks mainly through processes that support the work we do. We will continue our focus on managing risks, particularly strategic risks. Our leadership team discusses risk management every quarter, which includes assessing environmental or internal changes that may affect the Office's position. The Office's Audit and Risk Committee meets four times a year, and gives further insight and advice to help us to identify and manage risk. The Committee's report for 2012/13 is on our website, and outlines the Committee's purpose and summarises its work over the 2012/13 year.
1: Available at the World Bank website, http://info.worldbank.org/governance/wgi/index.aspx#home.
2 :Available at the State Services Commission's website, http://www.ssc.govt.nz.
3: See http://cpi.transparency.org/cpi2012.
4: See page 19 for further information about Novopay.
