Part 2: Analysis of insurance for public assets
2.1
In this Part, we set out our analysis of the information we collected about the insurance of public assets. We look at:
- the value of public assets;
- the extent of insurance for those assets;
- why some assets are not insured;
- the level of cover for insured assets;
- the cost of insurance;
- changes in insurance after 2010; and
- insurance in Canterbury.
Value of public assets
2.2
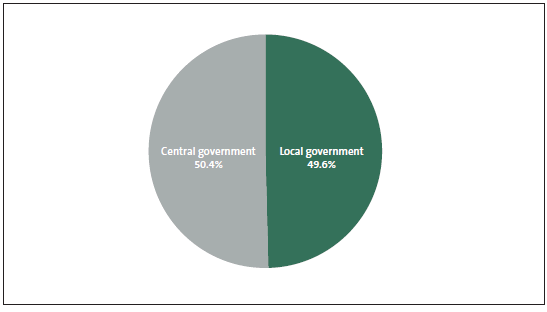
We collected information about the insurance of assets for more than 400 of the largest public entities. In total, these public entities' financial statements have assets recorded at about $225 billion. We refer to this as the carrying value of those assets. Figure 5 shows that these public assets are split fairly evenly between central government and local government, based on the information we collected.
Figure 5
Carrying value of central government and local government assets, as percentage of total sample
Extent of insurance cover for public assets
2.3
The information we collected shows that less than half of these public assets (based on their carrying value) have insurance cover. The cost of this insurance cover is about $280 million each year.
2.4
Because of the Canterbury earthquakes, there are many uninsured assets in Canterbury. In some instances, the increase in insurance premiums has made the cost of obtaining insurance prohibitive. In others, the perceived risk of earthquakes has made insurance simply unobtainable.
2.5
Having more than half of these public assets without insurance cover might seem like cause for concern. It could suggest that a significant proportion of public assets might not be able to be replaced after a catastrophe and therefore that public services may not be able to be provided in the future.
2.6
However, having uninsured assets is not necessarily cause for concern. This is because public entities can mitigate the risk of damage to, or loss of, assets in other ways. After assessing risks, public entities can choose to self-insure, such as relying on either their capacity to borrow funds or their cash reserves. A number of State-owned enterprises (SOEs), local authorities and related entities, and electricity lines businesses have chosen to self-insure some or all of their assets.
2.7
It is important to distinguish between public entities that properly analyse their risks and choose to self-insure and public entities that choose to do nothing because they consider insurance too expensive. We have not assessed the risk analyses of public entities that do not insure assets, to work out whether any have not analysed risks properly.
2.8
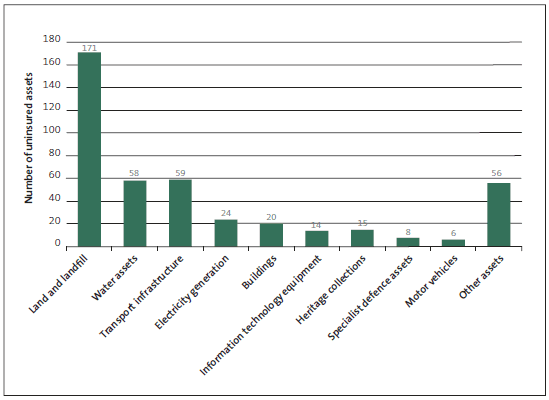
In general, the most common type of asset without insurance cover is land. This is not surprising because insurance is generally not offered for land. Figure 6 shows the types of public assets that are not insured. Land and landfills, water assets (for water supply, stormwater, and wastewater), transport infrastructure, and other assets (such as tunnels; plant, and equipment; furniture and fittings; and parts of electricity generation and distribution systems) are the most common assets without insurance cover.
Figure 6
The prevalence of different types of assets without insurance cover
2.9
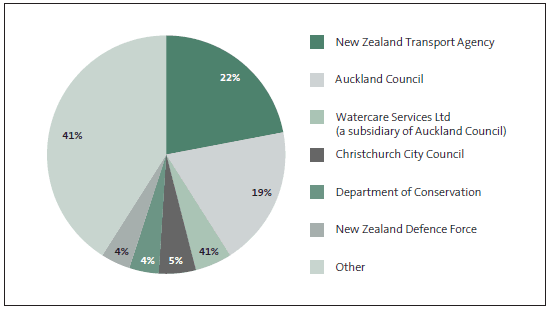
A few public entities account for most of the uninsured assets. Figure 7 shows that six public entities have nearly 60% of the assets (by value) without insurance cover.
Figure 7
Analysis of uninsured assets by entity
2.10
The six public entities identified in Figure 7 have a wide range of assets without insurance cover. They include land, landfill, transport infrastructure, water assets, flood protection assets, and buildings.
2.11
Further details about these six public entities are included in Part 3 (for central government entities) or Part 4 (for local government entities).
Reasons why some assets have no insurance cover
2.12
Commonly, the six public entities identified in Figure 7 do not have insurance cover for assets because:
- the cost of insurance is higher than the assessed risk; or
- the public entity could not get insurance cover.
2.13
Some public entities have concluded that the cost of insurance is too high for the risks being mitigated. In the last couple of years, several global disasters, including the Canterbury earthquakes, have changed the nature and cost of insurance cover in New Zealand, particularly in the short term.
2.14
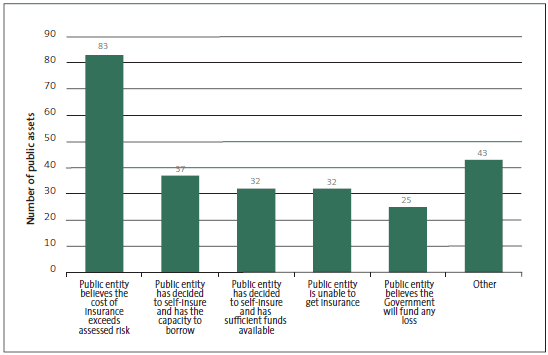
Figure 8 shows the reasons why some public assets, other than land, have no insurance cover. The most common reasons are that the cost of insurance exceeds the assessed risk or that the public entity has decided to self-insure. There could be more than one reason, and different reasons may apply for different assets owned by any one entity.
Figure 8
Reasons why some public assets have no insurance cover
2.15
An example of a public entity that chooses to self-insure is the New Zealand Police.
| What we found out from the New Zealand Police* |
|---|
|
The New Zealand Police's approach to insurance The New Zealand Police (the Police) have a strong risk-management culture and extensive experience in managing many assets. The Police's major assets are land, buildings, plant and equipment, and motor vehicles. At 30 June 2012, the Police had assets with a carrying value of $845 million. Of this total, $776 million was the value of land, buildings, and plant and equipment, and $69 million was the value of motor vehicles and vessels.† For many years, the Police have self-insured nearly all of their assets. The Police consider that self-insurance is the most appropriate and cost-effective option for their assets. Rather than relying on private insurance to cover any losses or damage to assets, the Police reprioritise funding available as part of their capital expenditure budget to cover any losses. The Police have experienced very low levels of loss or damage to land, buildings, plant, and equipment. However, because of the nature of Police work, the Police's fleet of motor vehicles has experienced higher losses. The nature of the work means that privately insuring the Police's fleet of motor vehicles would be prohibitively expensive. A number of factors have led the Police to choose to self-insure nearly all their assets. Risk management The Police have considered the risks to assets continuing to be available so that services can be delivered to the public. Various aspects of the Police's operations mean that the risk to assets is reduced. These are:
Although the Police self-insure nearly all of their assets, they draw on expertise from the private insurance market. For example, the Police use the services of a private insurance company when deciding whether to repair or replace motor vehicles. Experience from the Canterbury earthquakes In comparison to some public entities, the Police were fortunate that their assets were not significantly affected by the Canterbury earthquakes. The main Police Station in Christchurch was leased, so the Police did not have to fund the repairs. The Police's main asset loss from the earthquakes was a small Police Station in Lyttelton. The Police consider that, if they had owned a significant amount of land and buildings in Canterbury that were damaged by the earthquakes, they could have managed the repair process by reprioritising their capital funding. Concluding comments To manage risks to the availability of their assets, the Police have found self-insurance to be an appropriate, cost-effective option for their business. The Police's strong focus on risk management and business continuity planning, together with the geographical spread of their assets, has helped to make the self-insurance option viable. |
* The purpose of this example is to provide some depth to the analysis by showing one entity's experience of self-insuring, not to judge the validity or appropriateness of self-insurance.
† The amounts are from the New Zealand Police's 2012 Annual Report.
Level of cover for insured public assets
2.16
We collected information about assets that are insured and whether those assets had enough cover. When looking at the extent of insurance cover in place for public assets, we compared the total sum insured with the carrying value of assets covered by insurance policies. The results show that the total sum insured is about 80% of the carrying value of those assets covered by insurance policies. This shows that, potentially, public entities do not have enough insurance cover for assets.
2.17
It is worth noting that insuring the full carrying value of assets does not necessarily cover all risk. This is because the carrying value is typically lower than the full replacement cost, because the carrying value reflects the age and condition of assets. Therefore, even if insured for carrying value, a public entity is unlikely to have enough insurance cover to replace its assets. Even if the insurance cover is enough, the public entity will be required to pay the excess.
2.18
Further, the full replacement cost of an asset is likely to be only part of the costs to a public entity from losing an asset. Other costs include the costs of temporarily acquiring assets that are able to maintain services until a new asset can be acquired or built. The longer it takes to replace an asset, the greater these other costs are likely to be.
2.19
There are various reasons why public entities insure for a value lower than the carrying value. Some public entities have assets with a wide geographical spread and assess the likelihood of all their assets being destroyed at the same time as low. These public entities' risk assessment work concludes that a cap should be put on the insured value.
2.20
This shows how public entities might manage their insurance costs through a thorough assessment of risks to ensure that they do not pay for more insurance cover than they need.
2.21
Our findings suggest that some public entities have the capacity to borrow, and are able to self-insure some or all of their assets, or are able to have insurance that does not cover the full carrying value of assets. This is so for some State-owned enterprises and local government entities. However, we have not assessed the capacity of these public entities to borrow. Having the capacity to borrow provides some funding to cover the cost of an uninsured event.
2.22
A few central government entities have a sum-insured value that is significantly less than the carrying value of the assets insured. Some of this difference is offset by public entities where the sum insured value is more than the carrying value of assets.
2.23
Part 3 includes further details about public entities with a total insured sum that is significantly less than carrying value.
Cost of insurance for public assets
2.24
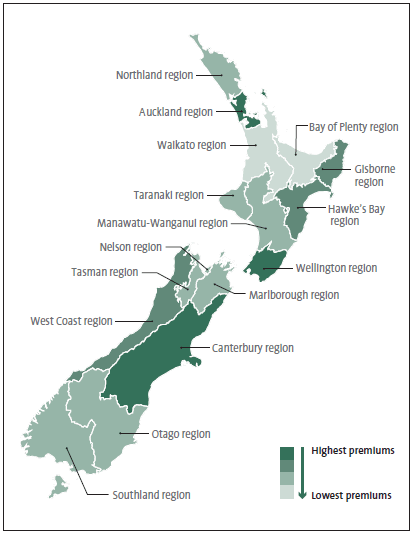
We estimate that about $280 million was spent on insurance premiums in 2012. We decided to analyse premium costs geographically by looking at the ratio of premium costs to the value of the asset sum insured for 16 regions. That ratio provides an indicator of the relative cost of insurance premiums.
2.25
The analysis includes only some of the entities we collected information about, because we excluded entities that have assets spread throughout New Zealand. Nevertheless, the analysis gives us an indication of the relative cost of insurance for public entities in different regions.
2.26
Figure 9 shows that public entities in Wellington and Canterbury pay higher premiums than in other regions, while public entities in Bay of Plenty and Waikato pay lower premiums than in other regions.
Figure 9
Relative cost of insurance premiums in 2012, by region
Changes in insurance after 2010
2.27
The insurance market has changed during the past couple of years. These changes mean that many public entities have had to change the way they use insurance to manage their risks.
2.28
Public entities have experienced higher premiums, higher excesses, and changes to insurance cover (often more policy exclusions). These changes have been experienced nationwide, not only in Canterbury. The changes have forced public entities to look closely at their insurance cover and costs, to ensure that their assets have the right insurance cover.
2.29
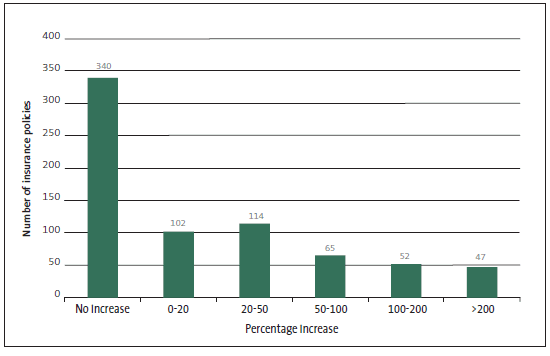
We sought information on the changes in insurance policies between 2011 and 2012. Figure 10 shows how much premiums increased between 2011 and 2012 for the 720 insurance policies that we collected information about.
Figure 10
Percentage increase in premiums between 2011 and 2012 for all insurance policies
2.30
Many insurance policies had significant premium increases in 2012. We found that about 40% of insurance policies had an increase of more than 20% in the insurance premium between 2011 and 2012, and about 14% of insurance policies had insurance premiums that more than doubled during that period. These increases are based on the absolute dollar value of premiums and do not reflect the effects of any reduction in insurance cover or increases in excesses.
2.31
Even where premiums have not increased by more than 20% (about 60% of insurance policies), public entities have often had to reduce the cover or increase the excess to hold premiums steady. In 2012, 10% of insurance policies had broad policy exclusions that were not there in 2011. There was also a significant increase in the level of excess for 13% of insurance policies. Public entities in Canterbury had more policy exclusions than public entities elsewhere.
2.32
The price and availability of insurance fluctuates as the insurance market responds to international and national events and other influences. There have been noticeable cycles in the movements of the insurance market after a costly event. Historical patterns show that insurance costs rise sharply after the event. However, they also show that, relatively soon after, insurance costs plateau and start to fall. Therefore, it is not surprising that, after the increases in insurance costs in 2012, most public entities did not expect insurance costs to continue to increase in 2013. Public entities did not expect a change in insurance premiums in 2013 for more than half of the insurance policies we collected information about.
Insuring public assets in Canterbury
2.33
As part of our analysis, we looked at public entities in Canterbury to see whether the information we collected contained any results that were different to the rest of the public sector. In particular, we wanted to see whether these public entities were able to obtain insurance, and whether the increase in insurance costs was higher than elsewhere.
2.34
We looked at 29 public entities in Canterbury that had about $11 billion total assets reported in their 2012 financial statements. We found that only about 25% of these assets were insured, leaving about 75% of assets not insured. This proportion of uninsured assets is significantly higher than what we found for all of the other public entities that we collected information about.
2.35
Christchurch City Council owns many of these uninsured assets. Since the earthquakes, insurance has been difficult to get, especially where there are outstanding earthquake claims.
2.36
About 60% of the public entities in Canterbury have at least one type of asset that has no insurance cover. This is high compared to the results for the other entities in the public sector that we collected information about. Uninsured assets are mostly land, buildings, and transport infrastructure.
2.37
The main reasons for public entities in Canterbury having uninsured assets - other than land - were that the cost of insurance is higher than the assessed risk, and the public entity had tried but could not get insurance. This last reason was not so common in other regions and suggests that insurance has been more difficult to obtain in Canterbury. In some instances, the increase in insurance premiums has made the cost of insurance prohibitive or simply unobtainable.
2.38
When comparing information for 2011/12 with 2010/11, there has been a significant increase in insurance premiums for nearly 60% of insurance policies covering assets in Canterbury. This percentage is fairly common in most sectors, which suggests that the increase in premium costs has been widely felt throughout New Zealand.
2.39
Also, the comparison showed that about 20% of entities in Canterbury had additional policy exclusions in 2011/12. This was higher than other regions, suggesting that, even where insurance was obtained, the cover was reduced.

