Appendix 2: Changes to primary health care funding since 2001
We use "primary health care funding" to refer to the funding for new subsidies and initiatives introduced under the Strategy and the funding for two existing subsidies (the General Medical1 and Pharmaceutical2 subsidies).
The Strategy has resulted in two main changes to primary health care funding. One was introducing a new method for subsidising patients’ visits to GPs (the First Contact subsidy).3 The other was increasing the amount of primary health care funding.
More than $3.2 billion has been spent on primary health care funding from 2002/03 to 2007/08. We give a breakdown of this expenditure in Appendix 3.
Figure 7 lists the several new subsidies and initiatives that have been introduced since the Strategy was launched in 2001 and the requirements for PHOs were established. Most of the new funding was directed to PHOs. We briefly describe these new subsidies and initiatives in Appendix 4.
Figure 7
Introduction of new subsidies and initiatives from 2002/03 to 2007/08
| Financial year | Subsidies and Initiatives |
|---|---|
| 2002/03 | First Contact Health Promotion |
| PHO Management Fees Services to Improve Access Other | |
| 2004/05 | Care Plus |
| 2005/06 | PHO Performance Payments |
| 2006/07 | Very Low Cost Access |
| 2007/08 | Zero Fees for Under 6s |
Source: Ministry of Health data.
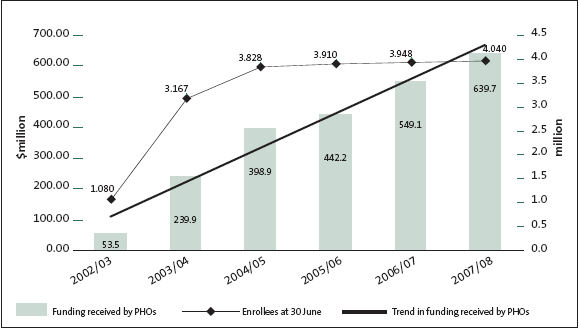
Figure 8 shows how funding was phased in to cover enrolled patients. Funding received by PHOs increased at a slower rate than increases in the number of enrolled patients, because patients were enrolled before the new funding was fully introduced.
Figure 8
Funding to PHOs compared with the number of enrolled patients from 2002/03
to 2007/08
Funding received by PHOs increased at a slower rate than the number of patients enrolled with PHOs, because patients were enrolled with PHOs before subsidies or initiatives were fully phased in.

Source: Ministry of Health data, February 2008.
Notes: Funding has been rounded to the nearest $100,000. Figures include all adjustments made to preserve the value of funding and to adjust or transfer payments as needed to ensure that each entity receives the correct payments. We have excluded any funding for “Other” subsidies and initiatives, some of which may have gone to PHOs.
The First Contact subsidy and increases to the Pharmaceutical subsidy account for about 70% of primary health care expenditure from 2002/03 to 2007/08. Figure 9 shows how both of these subsidies were phased in from 2002/03 to 2007/08.
Figure 9
Phased introduction and expenditure for the First Contact and Pharmaceutical subsidies from 2002/03 to 2007/08
| Financial year | |||||||
|---|---|---|---|---|---|---|---|
| 2002/03 | 2003/04 | 2004/05 | 2005/06 | 2006/07 | 2007/08 | Total | |
| ($m) | ($m) | ($m) | ($m) | ($m) | ($m) | ($m) | |
| First Contact | 43.7 | 199.1 | 326.2 | 357.2 | 428.7 | 487.5 | 1,842.4 |
| Pharmaceutical | - | 7.9 | 58.0 | 68.8 | 110.8 | 138.1 | 383.6 |
| Total | 43.7 | 207.0 | 384.2 | 426.0 | 539.5 | 625.6 | 2,226.0 |
Source: Ministry of Health data.
Note: Figures have been rounded to the nearest $100,000.
The First Contact subsidy was expected to lead to patients paying less to consult their GP or PHO, so they would be less likely to put off making necessary appointments because of the cost of doing so. The Ministry’s Annual Report 2005/06 said the new subsidies had reduced financial barriers to accessing primary health care services (see also example 3 in Figure 5).
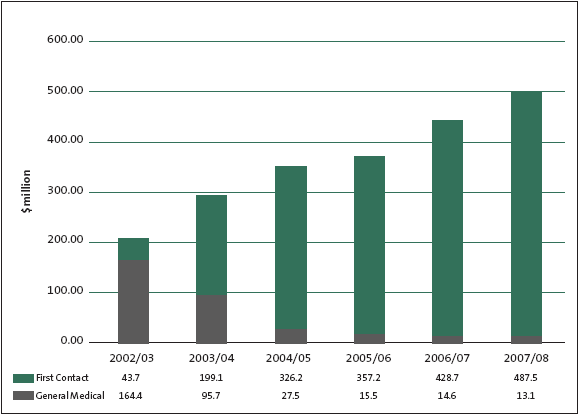
The First Contact subsidy replaced the General Medical subsidy as the main method of funding primary health care, and Figure 10 shows this shift from 2002/03 to 2007/08. Because GPs claim the General Medical subsidy when they see patients who are not enrolled with them, it will not be completely phased out. Non-enrolled patients may pay higher fees when they visit a GP or PHO.
Figure 10
Expenditure on the General Medical and First Contact subsidies from 2002/03 to 2007/08
Annual expenditure on the General Medical subsidy reduced as the First Contact subsidy was phased in. The combined annual expenditure for both subsidies increased from about $200 million in 2002/03 to about $500 million in 2007/08.

Source: Ministry of Health data.
Note: Figures have been rounded to the nearest $100,000.
1: This is a fee-for-service subsidy paid to GPs for visits by patients who are not enrolled with the GP’s PHO.
2: This is a subsidy paid to pharmacies for the costs of dispensing prescribed medicines. The maximum amount enrolled patients pay to collect subsidised medicines prescribed by their PHO is $3. The maximum amount is $15 in other circumstances. See Appendix 4.
3: This is a subsidy to PHOs for enrolled patients’ visits to general practices or other PHO services. It is a form of bulk-funding also known as capitation-based funding. The amount of the First Contact subsidy is decided by the characteristics of each PHO’s individual patients, such as age and gender. This capitation-based funding formula was also used to decide the funding for other subsidies and initiatives.
page top
