Part 2: Trends in the Ministry of Social Development's debt portfolio
2.1
In this Part, we provide an overview of trends and characteristics of the Ministry's debt portfolio, including:
- total debt;
- the number of current and former clients owing money;
- the size, age, and composition of debts;
- debt recovery; and
- writing off debt.
Summary: Responding well to debt growth
2.2
Economic conditions affect the amount of debt the Ministry manages. A weaker economy in recent years has meant more people receiving benefits. This has led to more overpayments. Also, more people in hardship have sought and received recoverable assistance loans from the Ministry.
2.3
The Ministry has responded well to this growth in debt by focusing on increasing the amount of debt it recovers. This has been achieved despite reductions in the number of Ministry staff directly involved in debt recovery.
2.4
The Ministry arranges repayment schedules with debtors quickly. At the time of our audit, more than half of the debt by value was less than a year old. Recovery rates are strong, and most people who owe money to the Ministry are repaying it.
Trends in total debt
2.5
Total debt has grown in recent years, especially since the economy entered recession in 2008. The weaker economy has seen increased demand for recoverable assistance (see Figure 1). With more people receiving benefits, the total sum of overpayments has increased (see Figure 2). In general, when more people receive benefits, the Ministry makes more transactions. This increases the incidence of overpayments. At the end of June 2010, a total of 332,924 working-age people were receiving the main social security benefits, up 29% from 258,317 people at the end of June 2008.3
Figure 1
Total money owed from recoverable assistance loans, by year, from 2007/08 to 2009/10
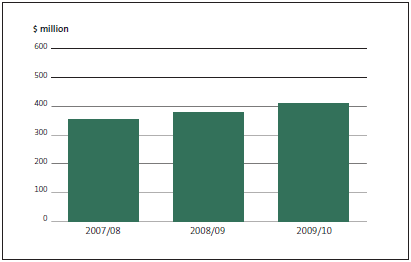
Note: Figures for earlier years are not available because the Ministry's systems aggregated recoverable assistance, overpayment, and fraud debts until mid-2007.
Figure 2
Total money owed from benefit overpayments and fraud, by year, from 2007/08 to 2009/10
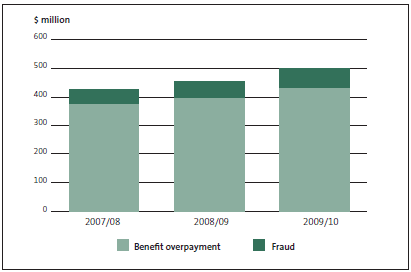
Note: Figures for earlier years are not available because the Ministry's systems aggregated recoverable assistance, overpayment, and fraud debts until mid-2007.
2.6
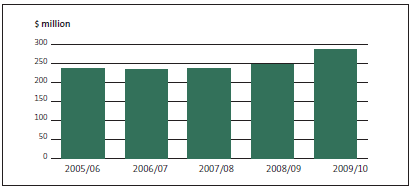
As debt has grown in recent years, the Ministry has recovered more money. Figure 3 shows that the amount of debt recovered increased by 15% between 2008/09 and 2009/10 (from $248 million to $286 million).
Figure 3
Debt recovered, by year, from 2005/06 to 2009/10
2.7
Examining the value of debt established each year, rather than just looking at total debt trends, provides more insight into debt patterns. Figures 4 and 5 show the trend with new debt established in each of the five years to 2009/10, broken down by recoverable assistance loans and overpayments. Figure 4 shows that amounts owed from recoverable assistance loans have increased. This is because the weaker economy has meant the Ministry has helped more people meet essential needs through the recoverable assistance programme. We expect demand for these loans to increase during difficult economic times.
Figure 4
New recoverable assistance loans, by year, from 2005/06 to 2009/10
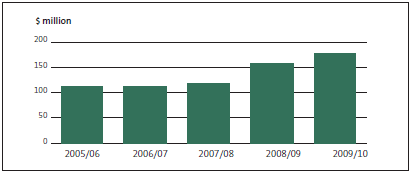
Figure 5
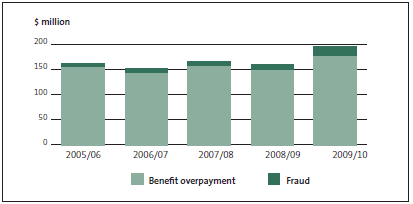
New overpayment and fraud debts, by year, from 2005/06 to 2009/10
2.8
In contrast, Figure 5 shows that new debt established because of overpayments remained relatively steady between 2005/06 and 2008/09, but increased significantly between 2008/09 and 2009/10. This is to be expected. Growth in unemployment since 2008 has increased the number of people receiving benefits. This boosts the volume of benefit transactions the Ministry makes, which increases the number of overpayments. However, as Figure 3 shows, more debt is recovered when more people are receiving benefits because the Ministry can more easily arrange with people to deduct repayments from their benefits.
2.9
Although economic conditions significantly affect total debt, it is important to note that year-on-year increases can also reflect an improvement in identifying overpayments.
Breakdown of debt by recoverable assistance, overpayments, and fraud
2.10
Before mid-2007, all overpayments and outstanding recoverable assistance loans were consolidated when shifted between the Ministry's systems.4 This meant that it was not possible to separate out overpayments, fraud, and recoverable assistance from total debt owed.
2.11
The Ministry has since improved how it records all debt transactions and can now produce a disaggregated view of all debt established since 1 July 2007. This information shows that a little more than half (51%) of the total debt established since mid-2007 was the result of overpayments and 46% was for recoverable assistance. Only 3% was the result of fraud.
Number of current and former clients owing money
2.12
When managing debt, the Ministry differentiates between current and former clients. Current clients are people receiving financial help from Work and Income. Former clients are people who no longer receive financial assistance from Work and Income but still have a debt from an overpayment or recoverable assistance loan. Although debt of former clients has decreased, increases in current client debt have driven the growth in debt since 2008. For example, current client debt grew by 15% between the end of June 2009 and June 2010, while former client debt increased by 1% during the same year.
2.13
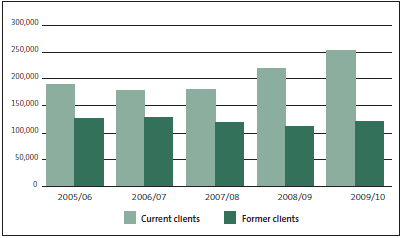
During the past five years, more than 300,000 people have owed the Ministry money at any one time. The number owing money to the Ministry tends to fluctuate with overall economic conditions. Figure 6 shows that the total number of people owing money to the Ministry has grown a lot since the 2008 recession because of a strong increase in the number of current clients with debt. In contrast, the number of former clients owing money to the Ministry has been relatively static in recent years. Current clients made up two-thirds of the total number of people owing money to the Ministry at the end of June 2010. Former clients made up the other third.
Figure 6
Number of current and former clients owing money to the Ministry, by year, from 2005/06 to 2009/10
Size, age, and composition of debts
2.14
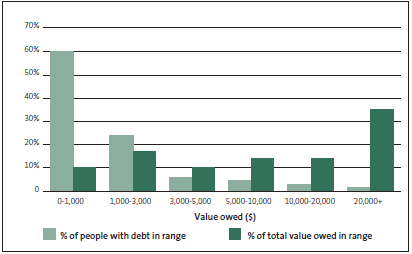
Although current clients commonly owe the Ministry money, the value of their debts is generally small.5 In contrast, a few current and former clients account for much of the total value of outstanding debt. These skewed distributions are apparent in Figure 7, which gives the distribution of total debt by value owed, as at the end of June 2010.
2.15
Two thirds (60%) of current and former Ministry clients in debt to the Ministry each owed less than $1,000 as at the end of June 2010. Combined, these people's debts accounted for only 10% of total outstanding debt. In comparison, 2% of current and former clients had debts exceeding $20,000. These debts accounted for more than a third (35%) of all outstanding debt by value. This skewed distribution reflects that:
- the small proportion of people owing large debts to the Ministry tend to have been detected after committing fraud over a long period; and
- most people owe small debts because of overpayments that the Ministry has quickly identified (and sought recovery arrangements for), or because they have been entitled to recoverable assistance loans – a 2009/10 Ministry briefing to a Parliamentary select committee on debt noted that 87% of current clients owing money had a recoverable assistance component to their debt, while 36% had an overpayment component.
Figure 7
Distribution of total debt (current and former clients) as at 30 June 2010
2.16
The Ministry's quick identification of debts means it has a young debt portfolio. At the end of June 2009, 51% of debt by value was less than a year old. This compared with only 30% of debt owed to the Ministry of Justice being less than a year old, and 12% of non-tax debt and 42% of tax debt owed to the Inland Revenue Department being less than a year old.
Recovering the money owed
2.17
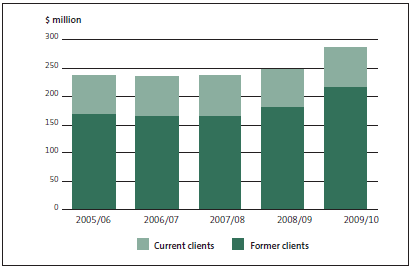
The Ministry has tended to recover about $240 million annually in recent years. Figure 8 shows that this amount had been relatively static in recent years but increased significantly in 2009/10, when $286 million was recovered.
Figure 8
Debt recovered from current and former clients, by year, from 2005/06 to 2009/10
2.18
The strong increase in debt recovery levels in 2009/10 reflects that more people are receiving recoverable assistance loans and benefits. It is generally easier for the Ministry to recover outstanding debt from current clients than former ones.6 It is usually easier to locate current clients, and then arrange repayment through direct deductions from their benefit payments, than it is to locate some former clients. On average during the past five years, 96% of current client debtors were repaying their debts to the Ministry. This compared with an average of 79% of former client debtors either repaying or having repaid their debts.
2.19
The average weekly recovery rate as at the end of June 2010 was $14.58 for current clients, and $25.74 for former clients. We discuss in paragraphs 3.15 and 3.22-3.24 how the Ministry needs to recover money while avoiding placing people in further hardship. The Ministry must avoid setting debt repayment levels for former clients at rates that might give them incentive to return to the benefits system. These considerations strongly, and appropriately, influence weekly repayment rates.
Writing off debt
2.20
The Ministry writes off only a small proportion of debt it is owed. Its write-off processes require the Ministry to exhaust all reasonable and practical recovery options before writing off any debt. Figure 9 shows that, during the five years to 2009/10, the Ministry wrote off between 1% and 2% of total debt owed in any given year. The annual amount of debt written off has reduced since 2007/08 as the amount of debt recovered has increased.
Figure 9
Debt written off, by year, from 2005/06 to 2009/10
| |
2005/06* | 2006/07* | 2007/08* | 2008/09* | 2009/10* |
|---|---|---|---|---|---|
| Balance outstanding at start of financial year ($m) | 788 | 817 | 831 | 857 | 910 |
| Amount of write-offs ($m) | (13) | (14) | (14) | (9) | (10) |
| As % of debt balance at start of the year | 1.6% | 1.7% | 1.7% | 1.1% | 1.1% |
* Note: These figures include total balances for all of the Ministry's debt portfolio and transactions, not just overpayments and recoverable assistance.
3: The main social security benefits include unemployment, sickness, domestic purposes, widow's, invalid's, and emergency.
4: For example, Work and Income's system for current clients would identify their recoverable assistance loans and overpayments separately. When this information was transferred into Integrity Service's system for former clients, the two types of debt were combined and identified only as an overpayment.
5: Overall, the average debt owed was $2,011 for current clients and $3,309 for former clients as at the end of June 2010.
6: In 2009/10, around 75% of total debt recovered was from current clients, with the remaining 25% from former clients.
page top
