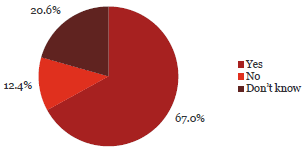
10. My organisation reviews its fraud controls on a regular basis (annually or biannually).
Observation:

67% say that their organisation reviews their anti-fraud controls regularly.
80% of Chief Executives had confidence that their organisation’s fraud controls were reviewed regularly. Only 49% of operational staff and 52% of line managers responded in the same way.
What some respondents have said:
“Board has an active Audit Committee, annually reviews fraud policy and also sensitive expenditure policy, and is considering a Fraud contingency response programme so as to have a system in place to respond to a fraud event.”
“It is managed through our Board Finance committee which reviews our Fraud policy every 2 years. I discuss with auditors each year when they visit, as does my Executive Officer. The policy is included in our policy manual which has a copy in the staffroom, but staff do not read and we do not take up time at staff meetings going over such matters - at a managerial level and at Board level we discuss and oversee what happens and be careful to prevent any fraud or corruption.”
“We have many checks in our system, but this survey has highlighted the need for us to regularly review our processes.”
“As a relatively small organisation, we do not have extensive processes for fraud prevention and awareness raising. However, we have simple checks such as clear authorisation procedures and management awareness of signs of potential fraud. These are considered by external audit to be appropriate for the size of our organisation.”
| Yes | No | Don’t know | Total Count | ||||
|---|---|---|---|---|---|---|---|
| Chief Executive Officer/Managing Director/Principal | 306 | 80% | 58 | 15% | 19 | 5% | 383 |
| Member of the senior executive/leadership team or equivalent | 337 | 68% | 72 | 15% | 83 | 17% | 492 |
| Line manager (if not one of the above) | 115 | 52% | 23 | 10% | 82 | 37% | 220 |
| Administration/Support Services | 135 | 67% | 14 | 7% | 52 | 26% | 201 |
| Operational staff (e.g. Teacher, Analyst, Advisor, Technician, Officer, Engineer, Accountant) | 67 | 49% | 11 | 8% | 59 | 43% | 137 |
| Total | 960 | 67% | 178 | 12% | 295 | 21% | 1,433 |
| Yes | No | Don’t know | Total | ||||
|---|---|---|---|---|---|---|---|
| Central Government | |||||||
| Autonomous Crown Entities | 43 | 80% | 4 | 7% | 7 | 13% | 54 |
| Central Government - Other | 36 | 78% | 2 | 4% | 8 | 17% | 46 |
| Crown Agents or Companies | 68 | 78% | 5 | 6% | 14 | 16% | 87 |
| Crown Research Institutes | 30 | 79% | 3 | 8% | 5 | 13% | 38 |
| District Health Boards | 45 | 64% | 6 | 9% | 19 | 27% | 70 |
| Government Departments | 78 | 53% | 16 | 11% | 53 | 36% | 147 |
| Independent Crown Entities | 25 | 68% | 1 | 3% | 11 | 30% | 37 |
| Māori Trust Boards | 7 | 64% | 3 | 27% | 1 | 9% | 11 |
| Rural Education Activities Programmes | 8 | 73% | 1 | 9% | 2 | 18% | 11 |
| State-Owned Enterprises | 37 | 79% | 0 | 0% | 10 | 21% | 47 |
| Tertiary Education Institutions | 72 | 79% | 2 | 2% | 17 | 19% | 91 |
| Sub-Total | 449 | 70% | 43 | 7% | 147 | 23% | 639 |
| Yes | No | Don’t know | Total | ||||
|---|---|---|---|---|---|---|---|
| Local Government | |||||||
| Airports | 7 | 37% | 3 | 16% | 9 | 47% | 19 |
| Council Controlled Organisations or Council Controlled Trading Organisations | 54 | 72% | 11 | 15% | 10 | 13% | 75 |
| Energy Companies | 16 | 57% | 8 | 29% | 4 | 14% | 28 |
| Fish and Game Councils | 6 | 75% | 2 | 25% | 0 | 0% | 8 |
| Licensing and Community Trusts | 6 | 67% | 2 | 22% | 1 | 11% | 9 |
| Local Authorities | 85 | 50% | 37 | 22% | 47 | 28% | 169 |
| Local Government - Other | 8 | 73% | 2 | 18% | 1 | 9% | 11 |
| Port Companies | 0 | 0% | 2 | 67% | 1 | 33% | 3 |
| Sub-Total | 182 | 57% | 67 | 21% | 73 | 23% | 322 |
| Schools | 329 | 70% | 68 | 14% | 75 | 16% | 472 |
| Total | 960 | 67% | 178 | 12% | 295 | 21% | 1,433 |

